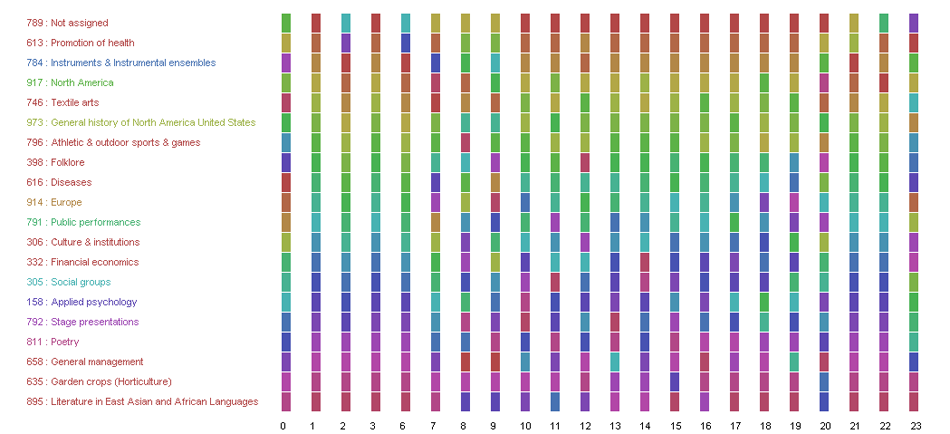
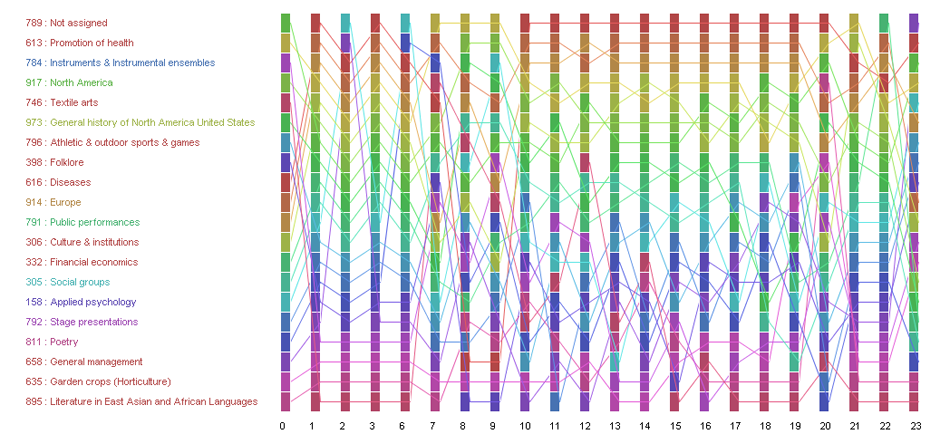
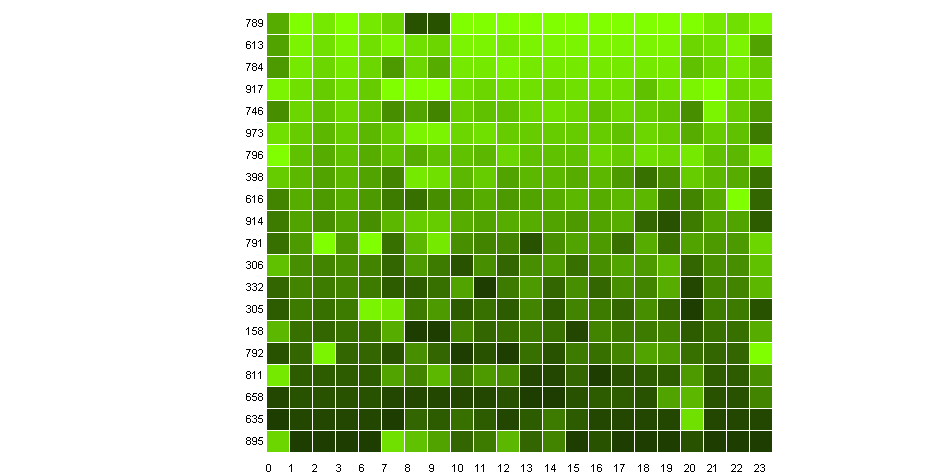
Earth

2D Spatial Map
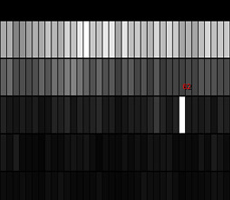
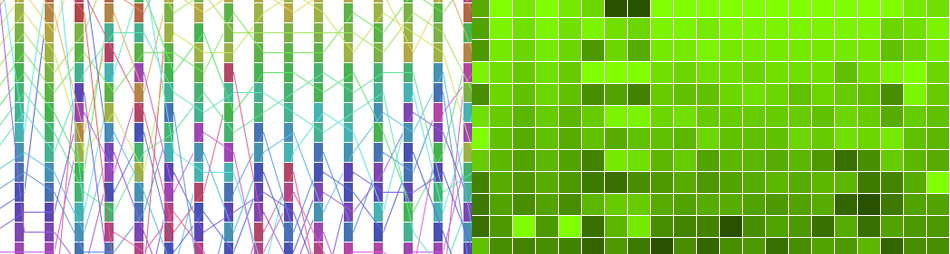
I wrote to show the ranks of the dewey classes in each hour and modified it so that you can look across each row (dewey category) and see how it's rank changes based on the brightness of the squares and HSV colors. You can see for example that dewey class 789 falls in rank at 8 and 9 am and also see how much the ranks fluctuate for each class based on the diference in brightness. Also you can look at the vertical columns to see how the categories compare in rank to each other.


Info
Year: 2013
Type: Data Visualization

Tools: Processing, MySQL

Concept Design, Visual Development, User Experience Design: Yoon Chung Han
Advisor: Prof. George Legrady


Cloud Bridge
Interactive Data Visualization and
Sonification
Earth
SPL Data Visualization
Seattle Musicians
SPL Data Visualization
North + South Korea
SPL Data Visualization
2D Spatial Map
SPL Data Visualization, M259 Class Lab exercise
Microsoft vs. Apple
Infographic, SPL Data Visualization
Pattern Formation
Algorithimc Pattern Creation Practice
Sound Tree Rings
Sound Visualization