Earth
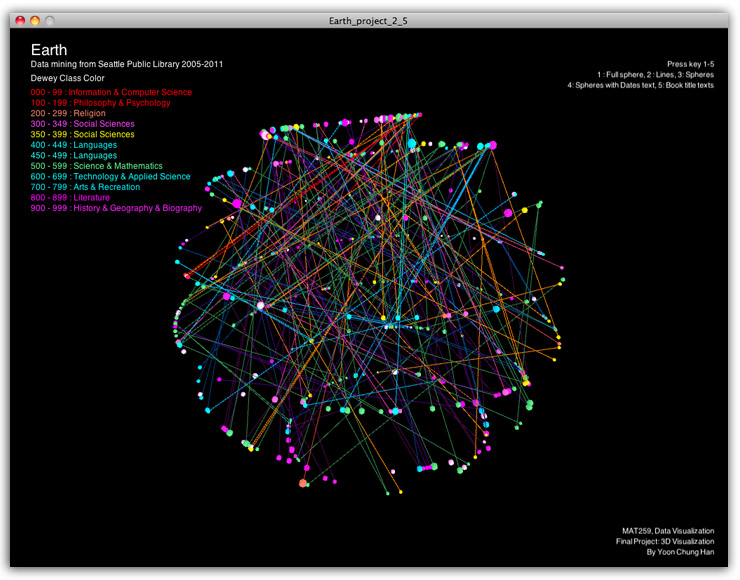
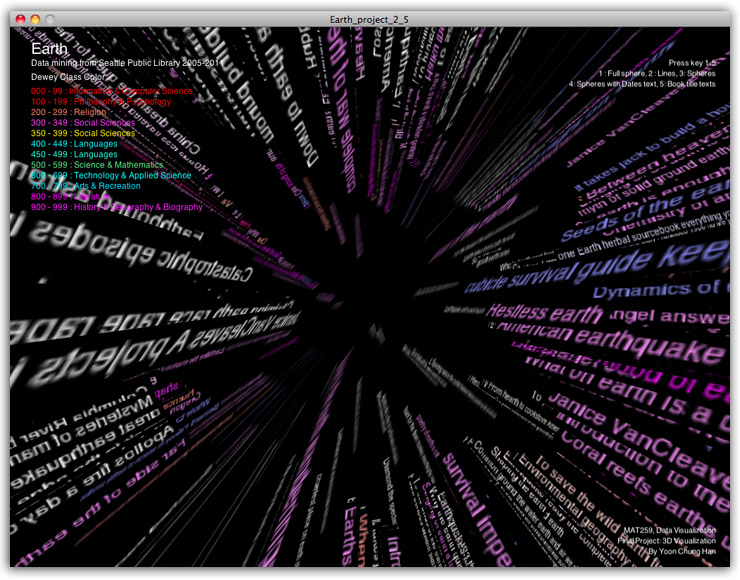
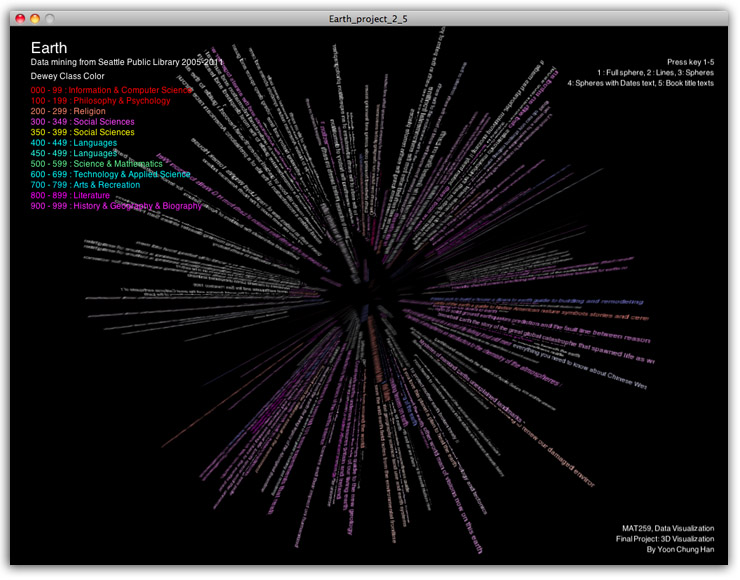
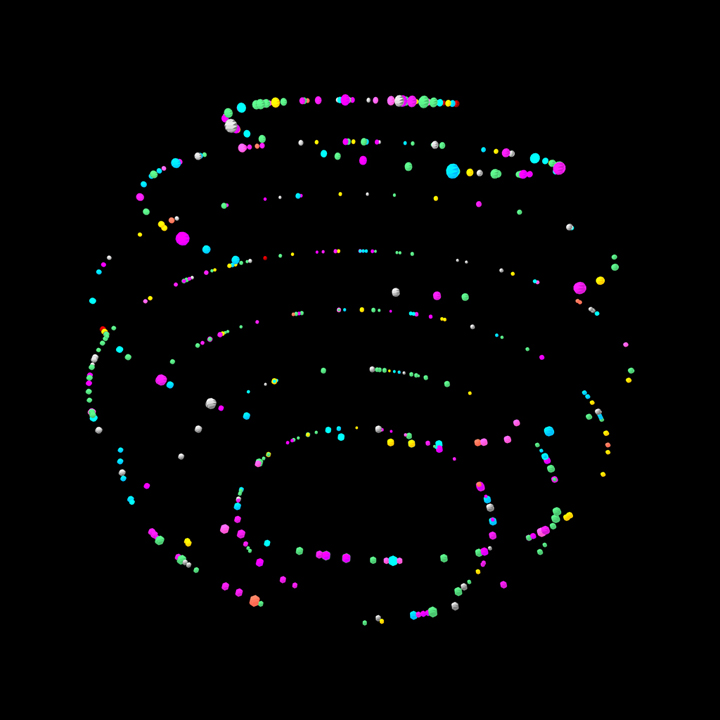
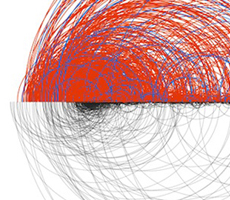
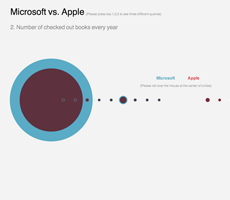
The main goal of this project was to explore total transactions between 2005-2011 related to "Earth." The query searched the whole transactions that had more than 20,000hours(833days, 2.28years) checked out duration. The book contents included "Earth" in titles or keywords.
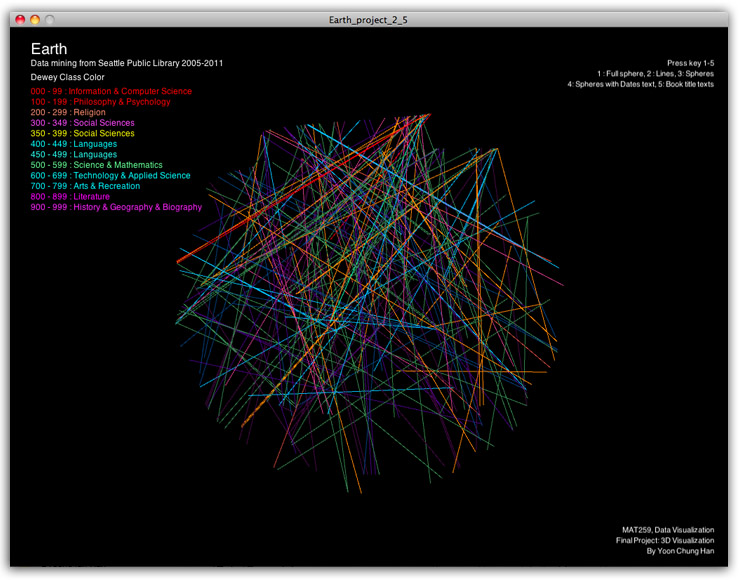
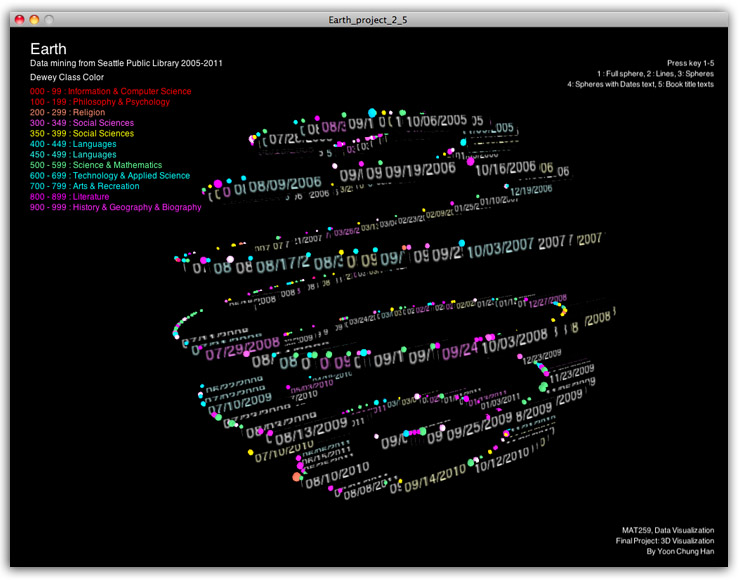
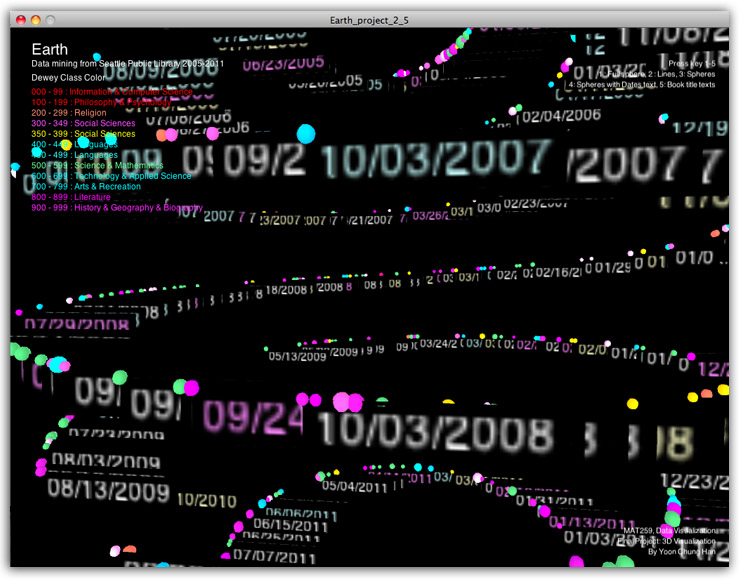
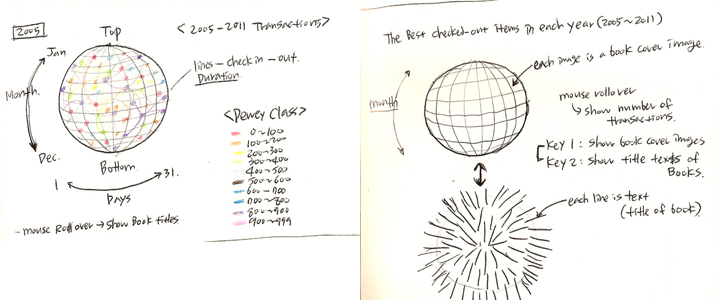
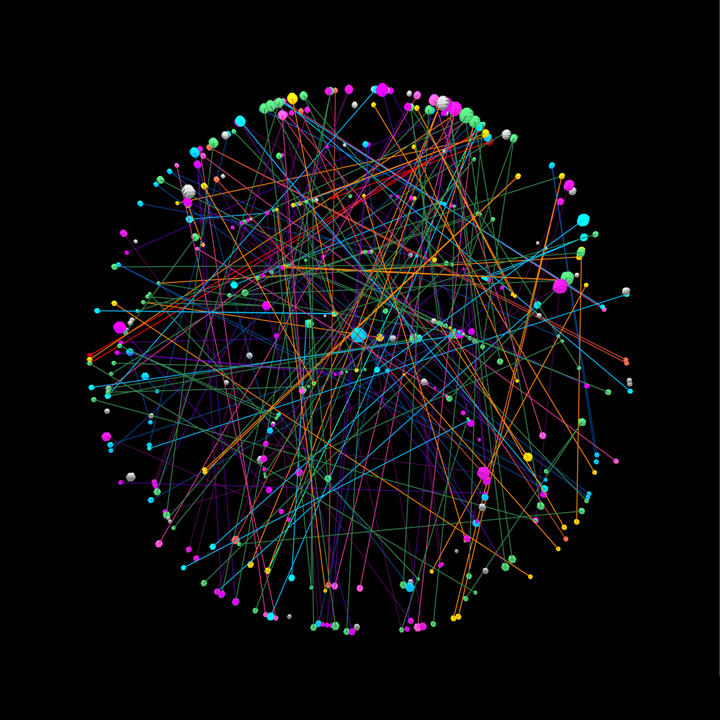
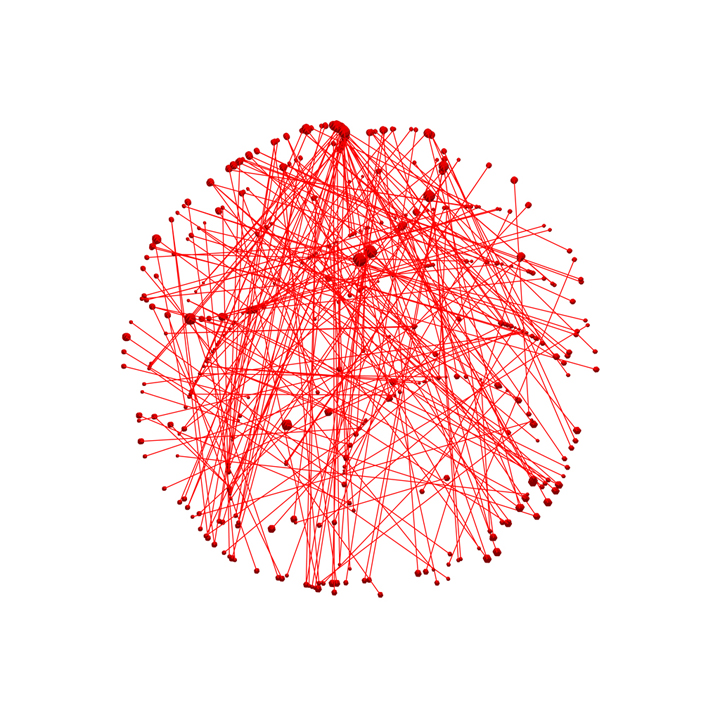
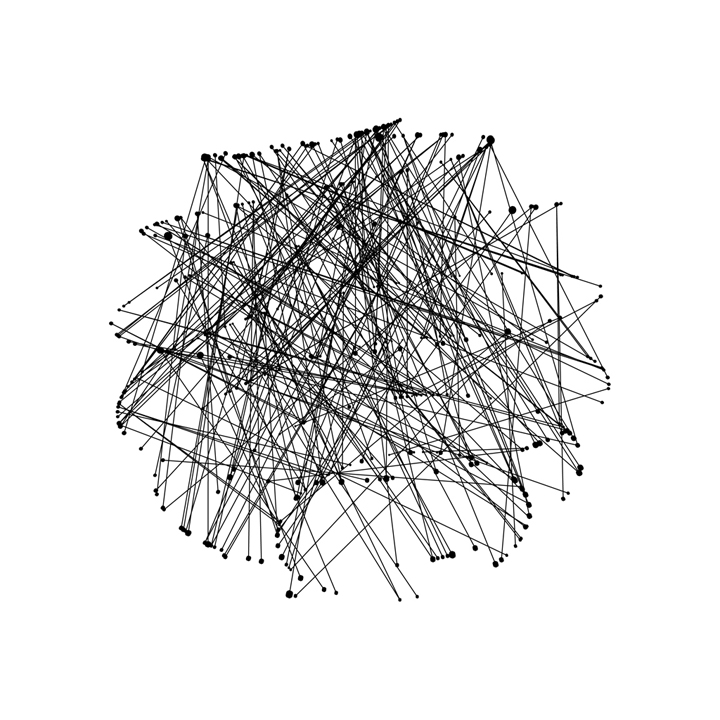
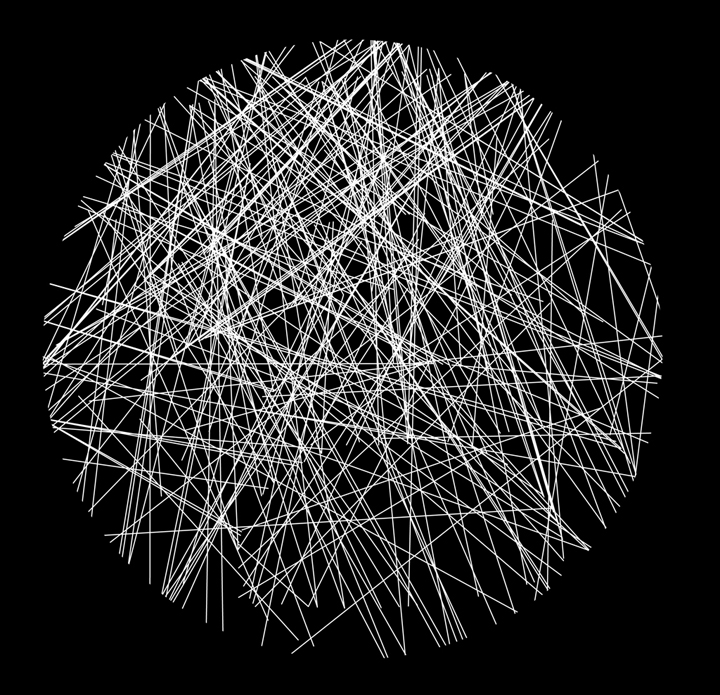
The overall visuals looked like a 3D sphere or Earth. Each different colors represented different Dewey classes. There are two parts of designs: first one is based on 3D sphere structure. Second one is a text sphere. Based on timely spiral shape, small spheres were situated from top to bottom, and the radii of spheres represented the duration of transactions. And the lines across the spheres connected each checked out and in items with the same dewey colors. You can see only spheres, or lines by pressing key 1,2,3. Also, each year,month,day date and duration numbers show up next to each spheres when you press key 4. Finally, all the book titles are shown up from the center, and spread toward to outside. (key 5)