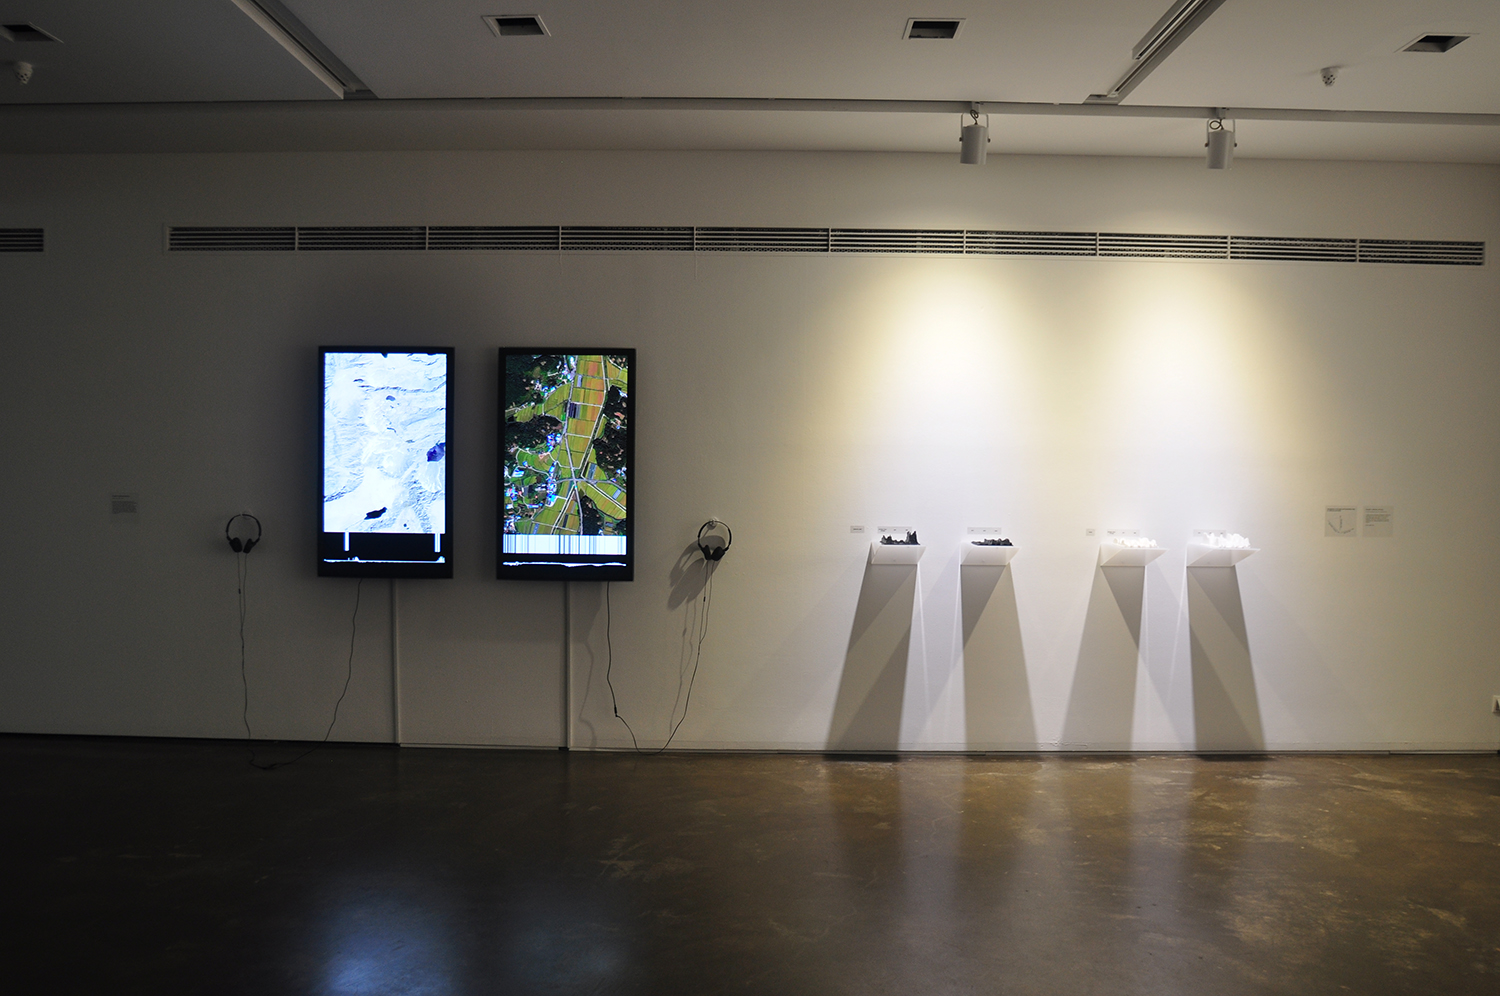
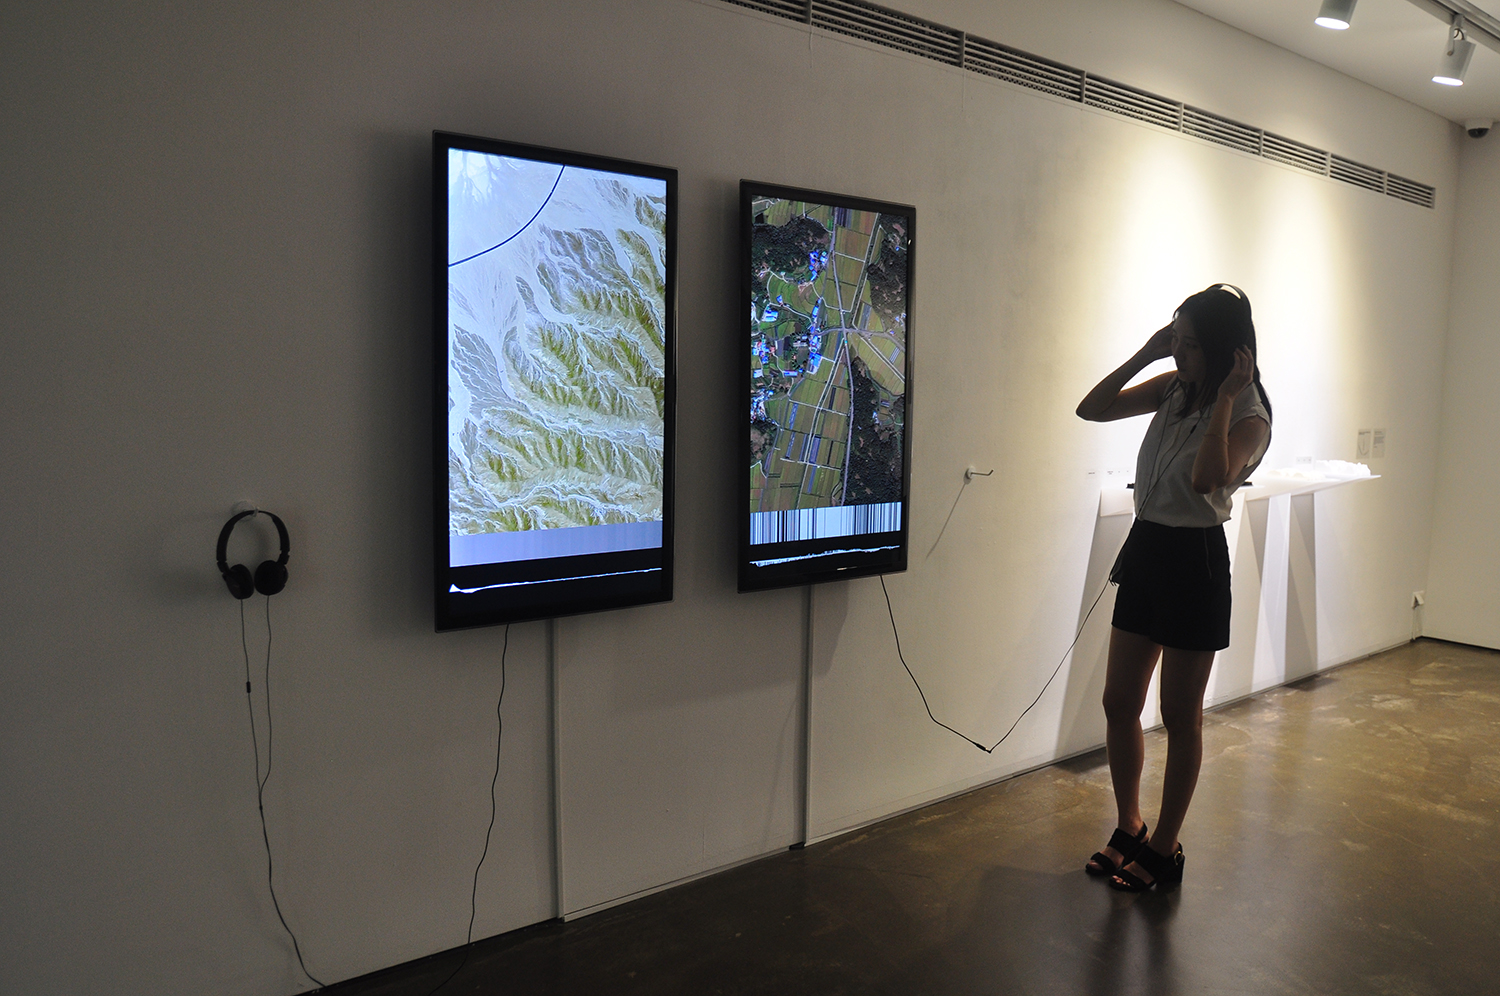
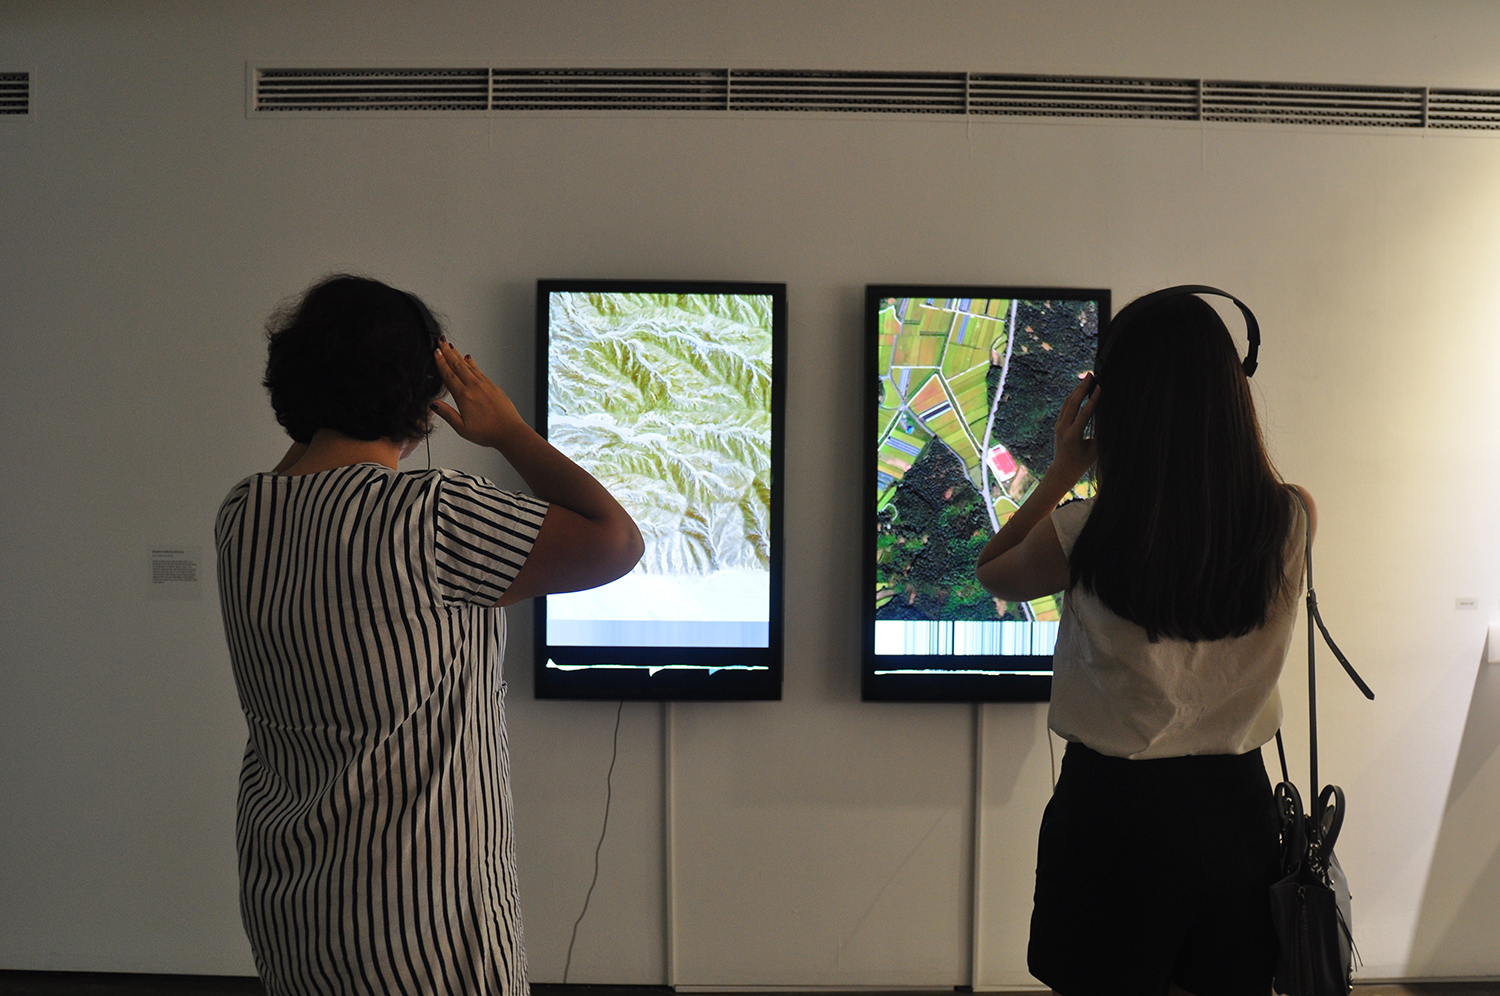
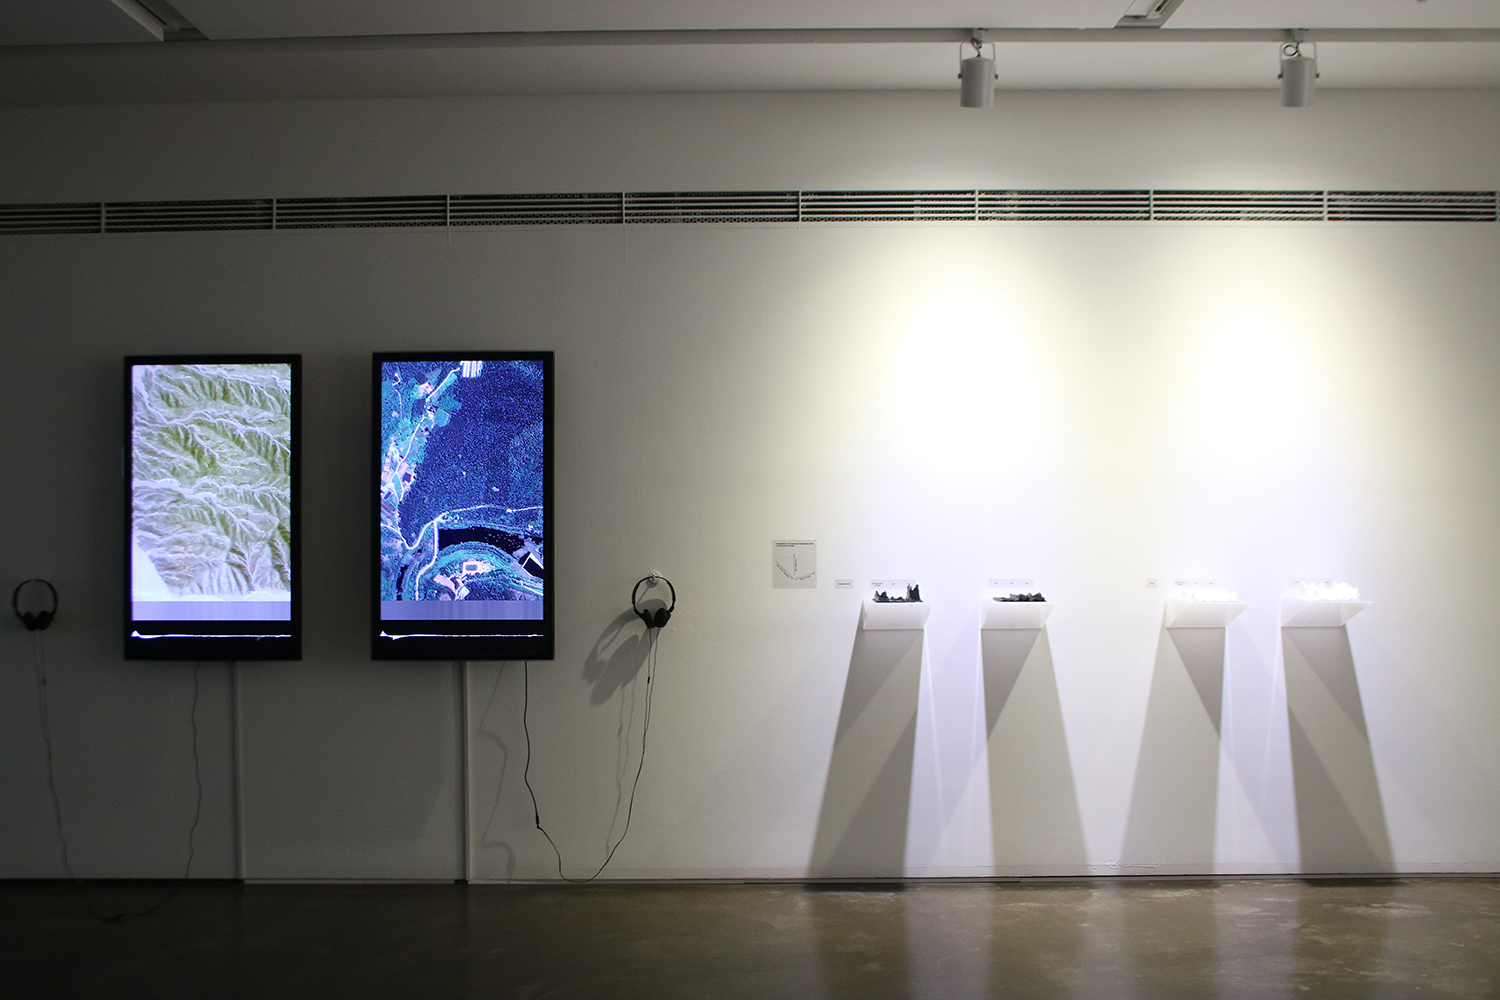
Drought in California and South Korea (video)
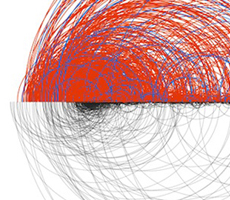
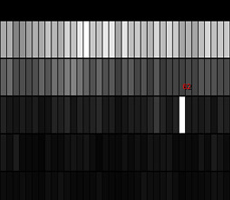
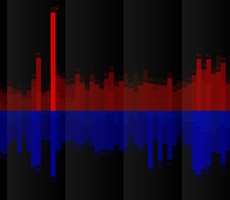
Drought in California and South Korea addressed the drought issues in two regions (California, USA and South Korea) Both areas have been experiencing its most severe drought in the past ten years. As a California artist/designer and native Korean, I was curious how two locations show different recoveries, changes, struggles and experiences impacted by the drought. Impact by water, climate, geological aspects is the crucial cause for the drought. The viewers can read how the data of the drought in the two regions have been changed over time through the data sonification. This work is a documentation about one of the environmental issues and explorations on new ways of visualizing and sonifying data.