California Drought Impact
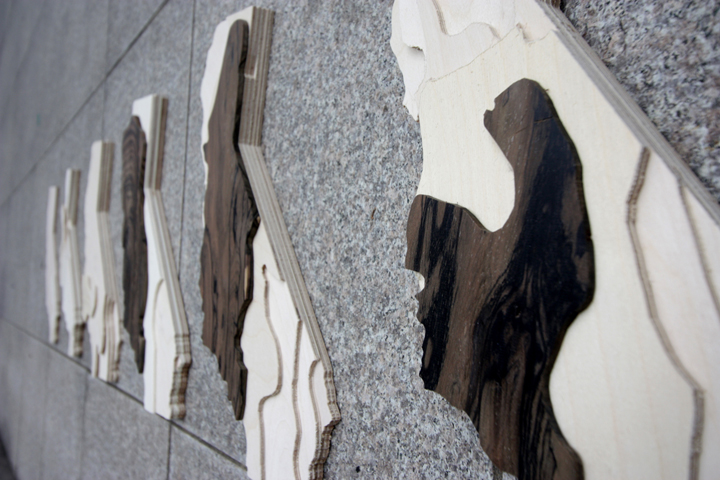
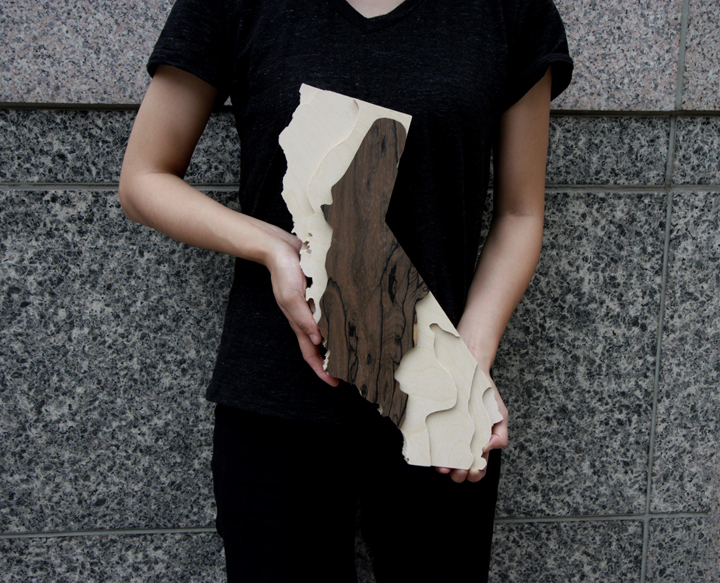
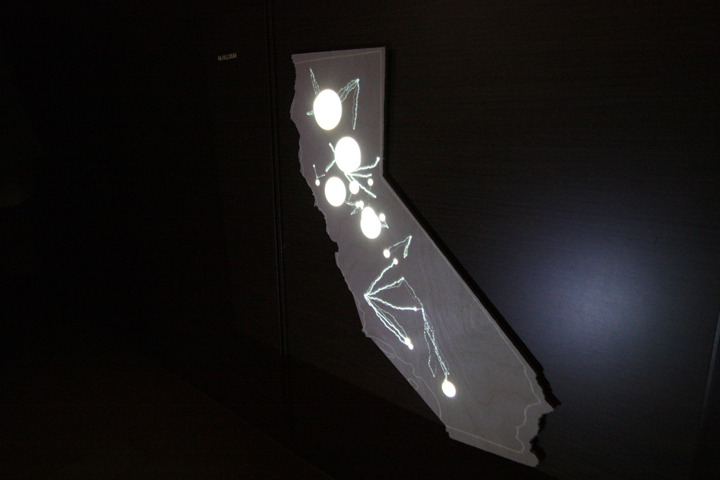
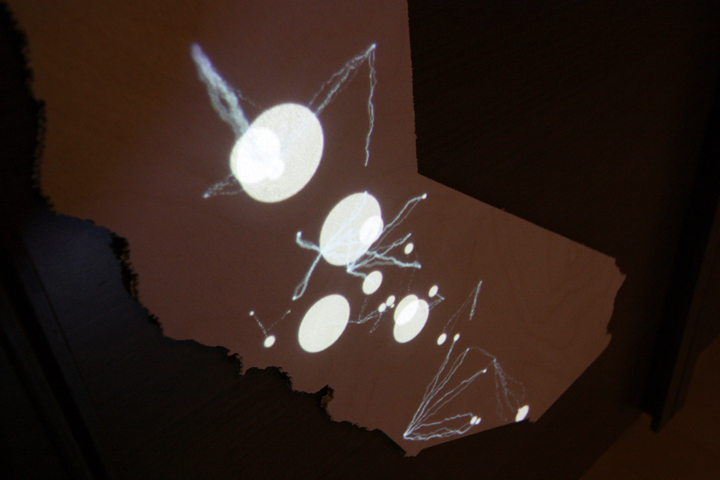
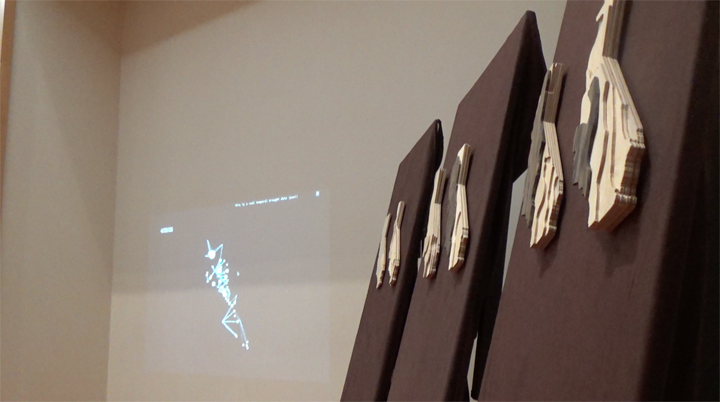
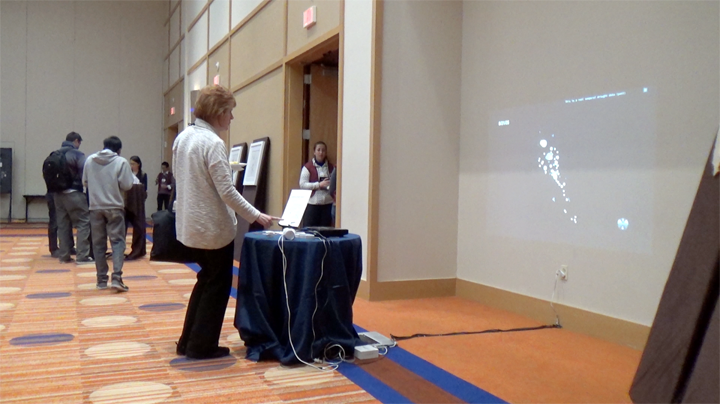
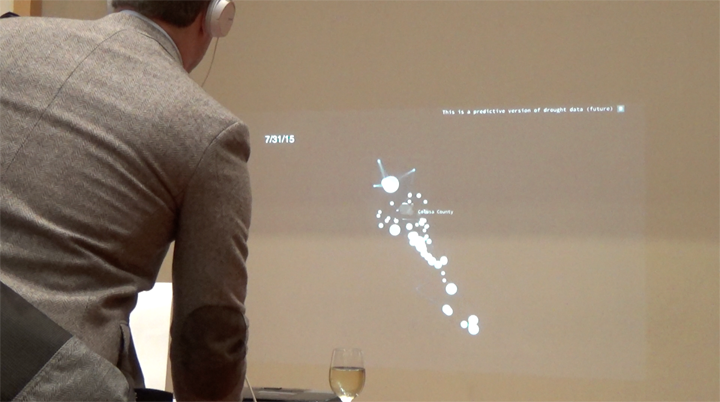
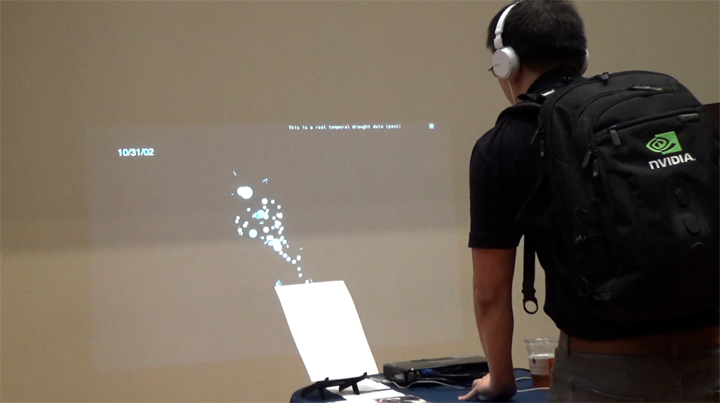
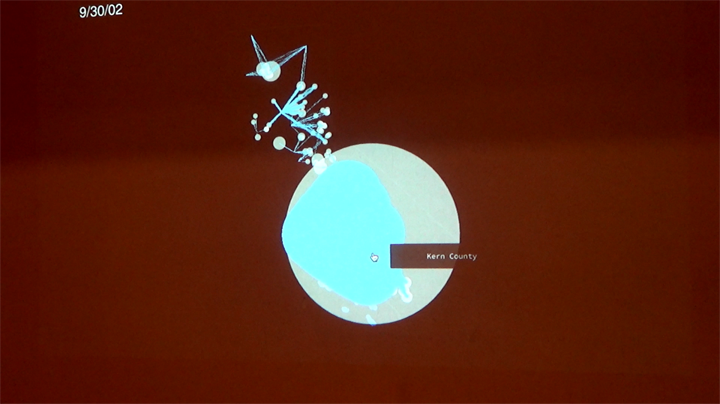
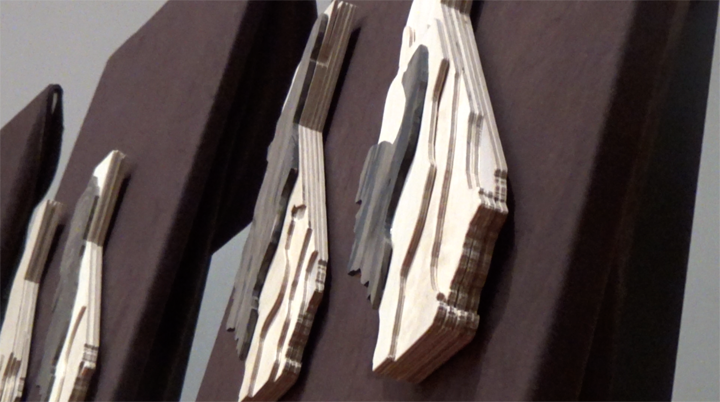
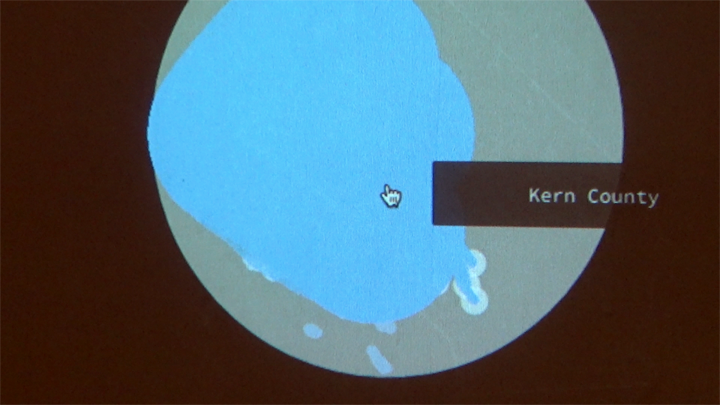
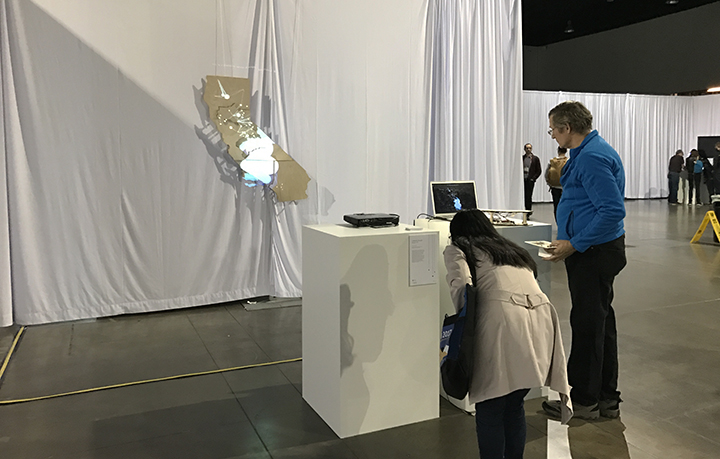
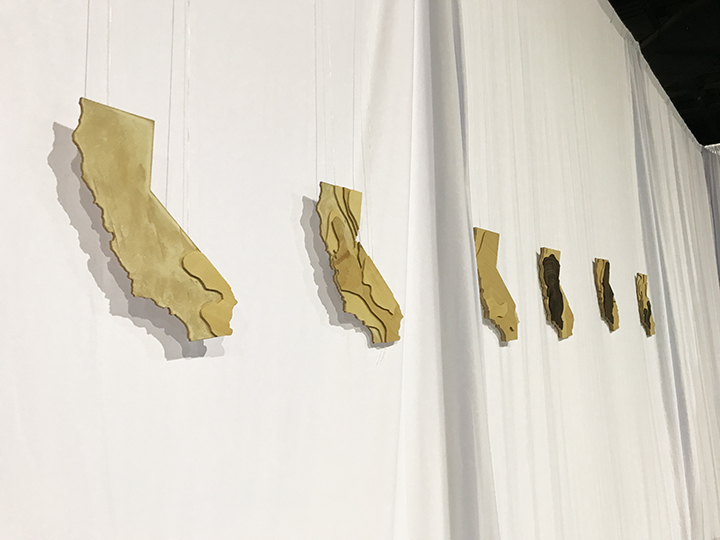
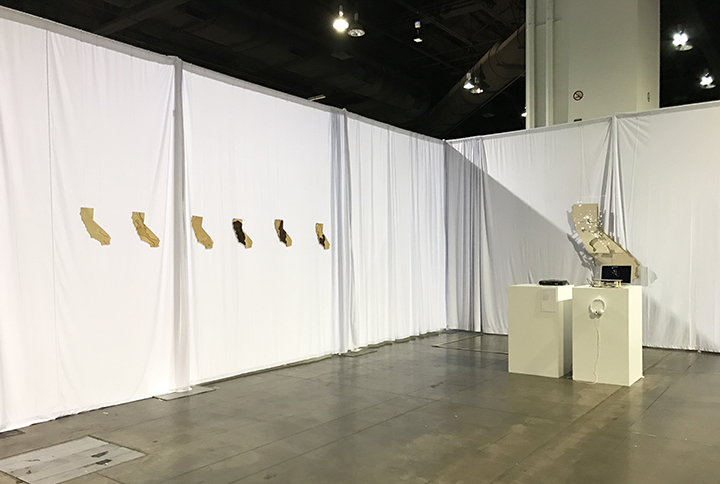
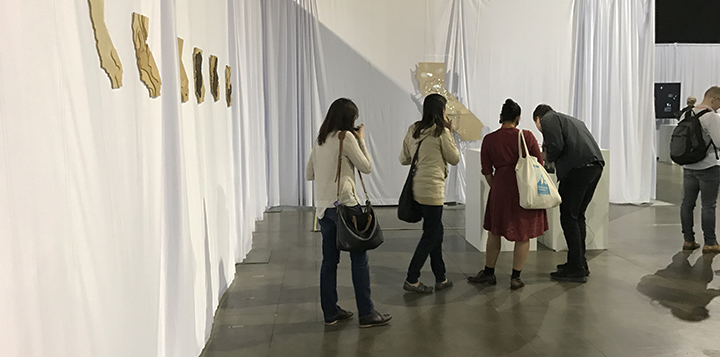
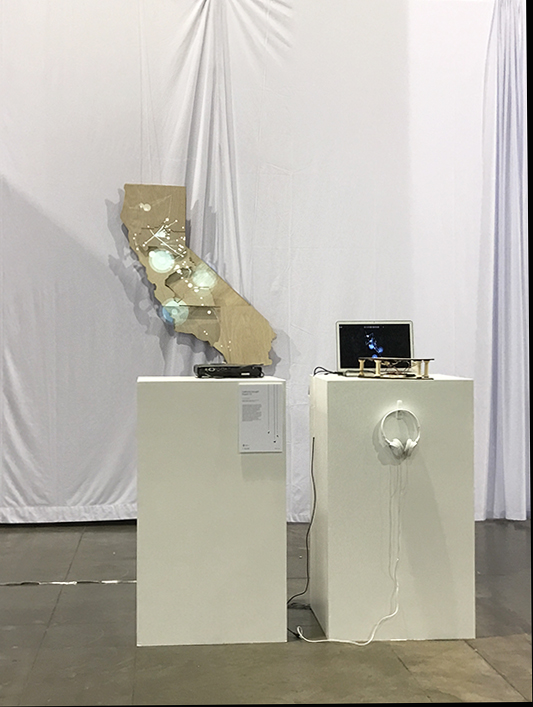
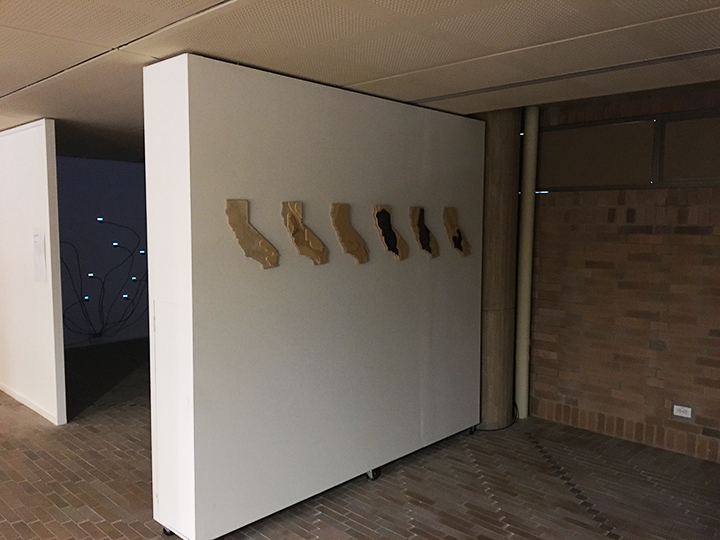
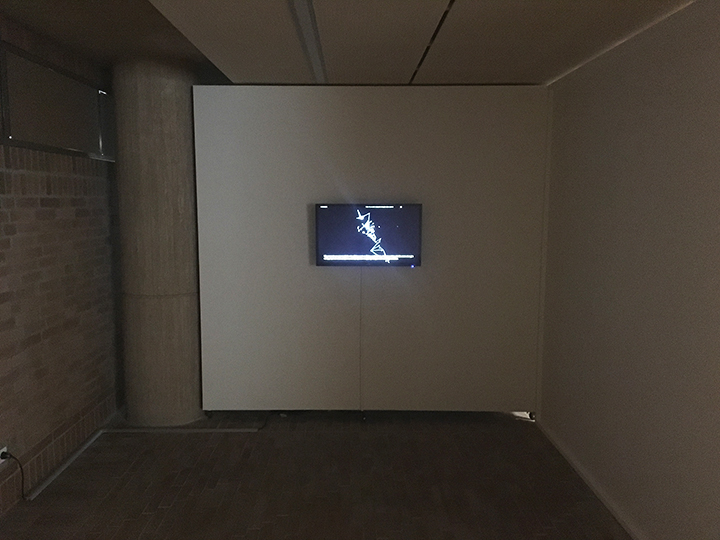
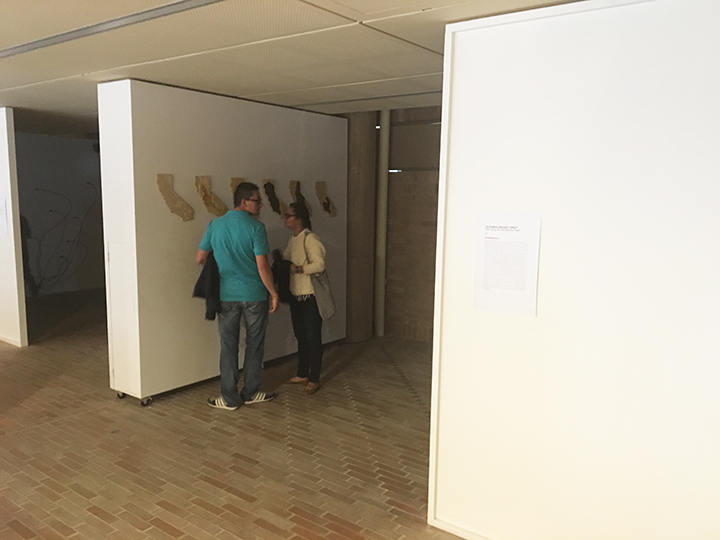
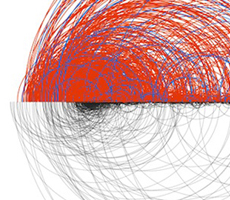
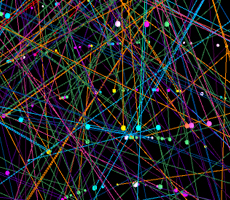
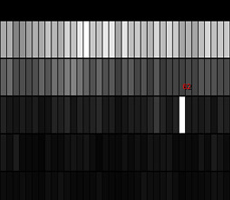
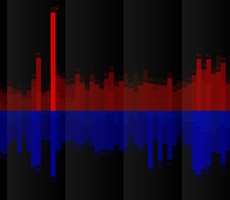
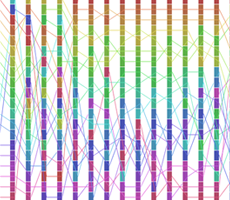
California has been experiencing its most severe drought in the past five years. Drought has affected water changes, biological phenomenon and the ecosystem, which has become an inspiration and great resource to artists and designers because it had a significant impact on the sustainability and the environment. These questions and issues have been our inspirations, and we create an interaction tool to depict the causes and impact of the drought and promote awareness of water consumption and ecosystem. California Drought Impact, an interactive multimodal data artwork, visualizes and sonifies multivariate data describing California’s drought using lasercut wooden sculptures and digital visualization with sonification using hand motions and camera tracking. This work aims not only to explore new aesthetically meaningful visualizations but also to allow users to learn about the causes of drought by examining the past and present and predicting the future of the California water system as both an art installation and a potential educational application. It depicts the past, present, and future of the drought by altering water morphology (water metamorphosis), which occurs as a result of climate changes. This data representation also leads to a new media interactive interface utilizing audio synthesis, visualization, and real-time interaction.
Publication
Yoon Chung Han, California Drought Impact v2: Interactive Data Visualization and Sonification using Advanced Multimodal Interaction, CHI 2017 Arts, 2017.
Yoon Chung Han and Shankar Tiwari. California Drought Impact: Multimodal Data Representation to Predict the Water Cycle, IEEE VISAP, 2016.
Yoon Chung Han and Shankar Tiwari. California Drought Impact: Multimodal Data Representation to Predict the Water Cycle, IEEE VISAP, 2016.