Algorithmic Visualization

Class Overview

A production course in data query, analysis, processing and visualization. The course began with MySQL data queries, followed by visualization assignments in the java based Processing environment. There were 3/4 projects: 1) A linear frequency visualization, 2) 2D spatial map, 3) a correlation with an external data source such as the NY TImes or Amazin, and 4) a 3D interactive visualization.

Given the short time to realize these projects, students used a specific multivariated dataset of over 70 million transactions for which various visualization modules have been created to help us focus on the goals of the course: To learn how to use visual language by which to represent abstract data.

The data used in the course was representative of any datasets. It consisted of library transactions of titles of books, DVDs, CDs and other media checked out by the general public since 2005. Every dataset contains the same scalar, numeric, time-based, semantic and other forms of metadata which allow for a multiplicity and complex modes of data correlation and representation. The goal of ths course was to learn how to discover interesting patterns in the data, and how to visualizat it.

My Responsiblities

These classes met twice a week, and every Thursday I led a lab session for two hours to teach students about data mining, MySQL, Javascript, and Processing. Most students were Masters level or PhD students from a wide range of departments: computer science, media arts and technology, statistics, and art history. My responsibilities were to teach and lead Lab session every Thursday, present my class examples and demonstration, and archive and design the class website. The most impactful part of these classes for me was in seeing how effective the class examples and documentation could work for students. Since some of students did not have any background in computer science or engineering, I created very basic examples for them, and very advanced levels of examples for expert-level students. I conducted extra lab sessions in my office hours, and helped beginner students solve their technical problems. Through creating and delivering the code demonstration, I could learn more details on the programming, and even caught unexpected issues in implementing small details when students asked the details in my code. My examples are now much concrete and work better in a more stable and expedient state. Furthermore, since these students had a deep knowledge in media art, engineering and computer science, the discussion level of the class also taught me how to lead discussion at the higher level of graduate student learning.

Pedagogy 1: First, create Idea Sketches by hand drawing, and Implement it in coding

The instructore and I emphasized students to start with drawing their own ideas by hands first. This is very effective way to organize their segments of broad ideas, brainstorm variations, and narrow down to the final idea with specific details. Furthermore, students can think how to transform data into visuals.This prevents to unnecessary programming implementation with vague and unclear idea, which save more time and effort. Here are some examples of students' projects that their preliminary sketches were successfully implemented in Processing sketches. (top: Jay Byungkyu Kang, bottom: Saeed Mahani)

Info
Year: Winter 2013
Course: MAT259 Visualizing Information (4 units)
Location: Media Arts and Technology, University of California, Santa Barbara

Tools: Processing, MySQL, Data Mining

Instructor: Prof. George Legrady
Teaching Assistant:Yoon Chung Han

Course website:
http://www.mat.ucsb.edu/~g.legrady/academic/courses/13w259/13w259.html
Course Archive website:
http://vislab.mat.ucsb.edu/2013.html


Pedagogy 2: Iterate to create varations of design based on discussion session

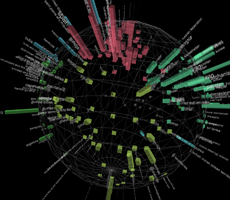
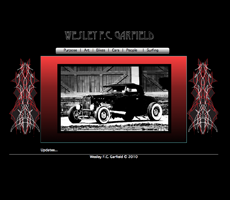
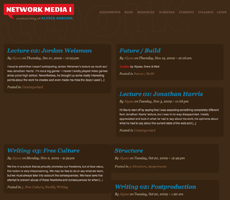
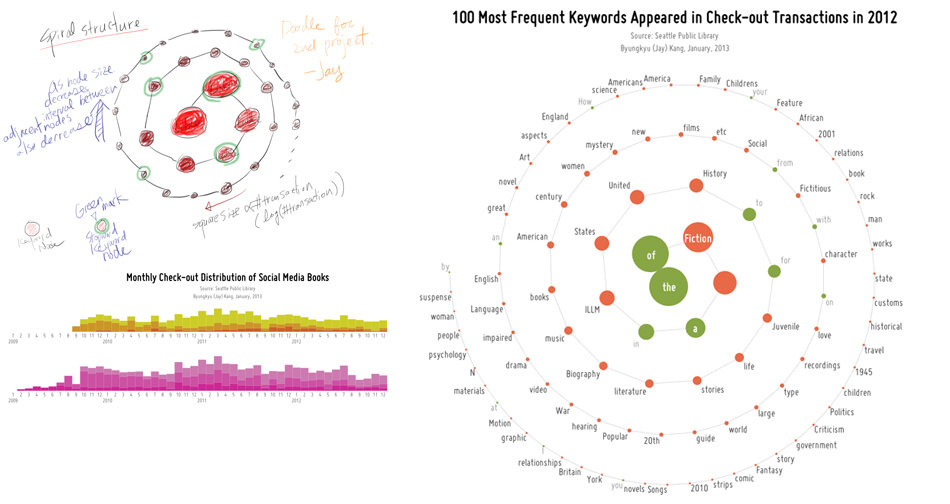
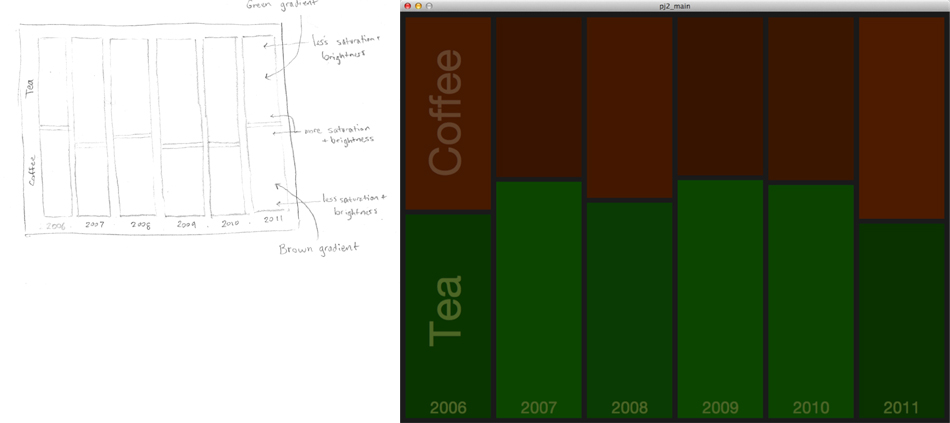
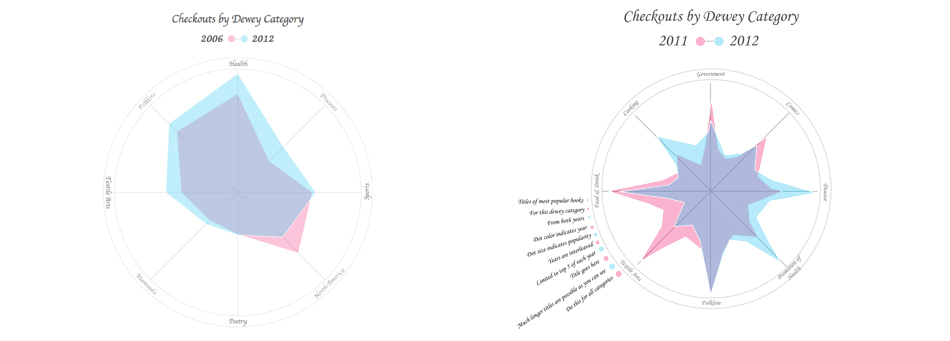
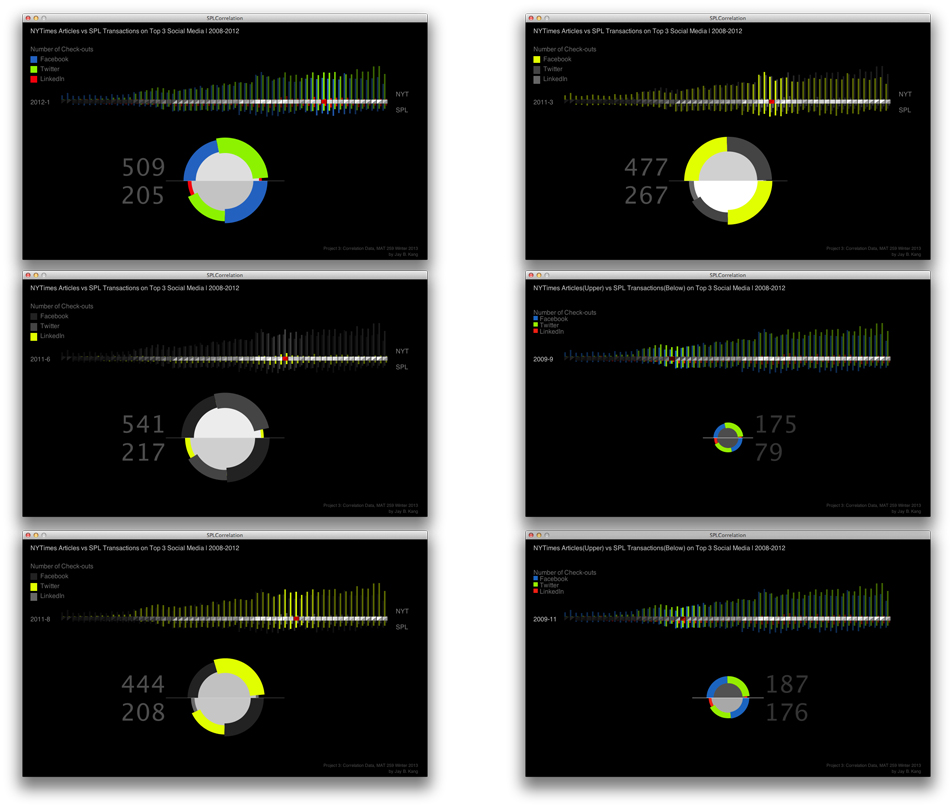
Throughout conversation and critique session, everyone in the class shared their ideas, suggestions, and any relevant references each other to improve the quality of their projects. Based on the comments from the session, students should iterate to fix and improve their Processing sketches to reach the best quality. Students who have no background at art and design struggled at finding good color choice or visual layout on the sketch. They kept modfiying their sketches with creating various versions and compraring them to see what parts look clear to deliver data and user interaction. Some of students examples are like below: (top: , middle: Saeed Mahani, bottom: Jay Byungkyu Kang)


Pedagogy 3: Step-by-step demonstration and class examples for students in different levels

The most impactful part of these classes for me was in seeing how effective the class examples and documentation could work for students. Since some of students did not have any background in computer science or engineering, I created very basic examples for them, and very advanced levels of examples for expert-level students. I conducted extra lab sessions in my office hours, and helped beginner students solve their technical problems. Through creating and delivering the code demonstration, I could learn more details on the programming, and even caught unexpected issues in implementing small details when students asked the details in my code.


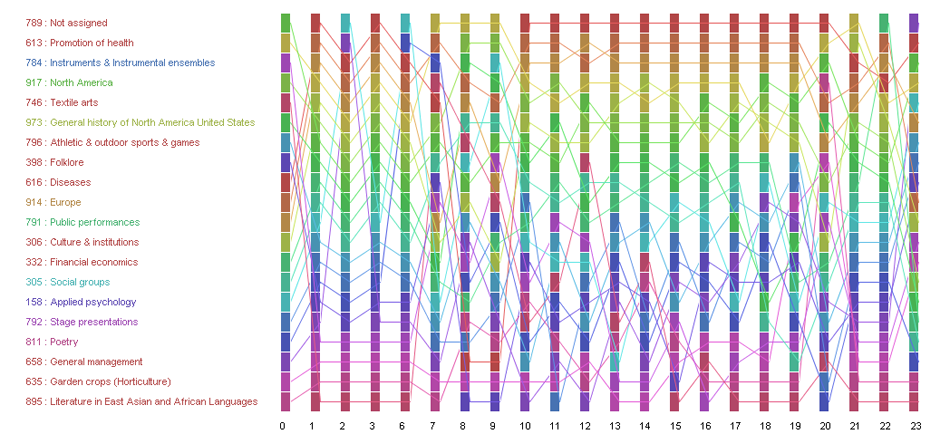
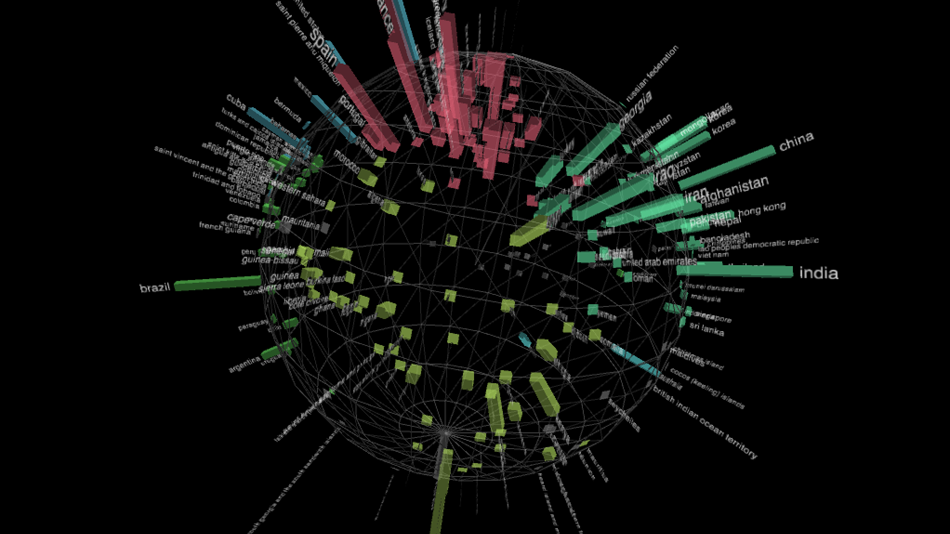
Class example 1. (advanced version) This sketch shows how the most popular dewey classes of checked out items are changed in hour. Each color on squares represents each different dewey class. The lines connect those squares to show how thier popularity fluctuated over time. This sketche has key control so that users can show/hide the lines by typing a key.


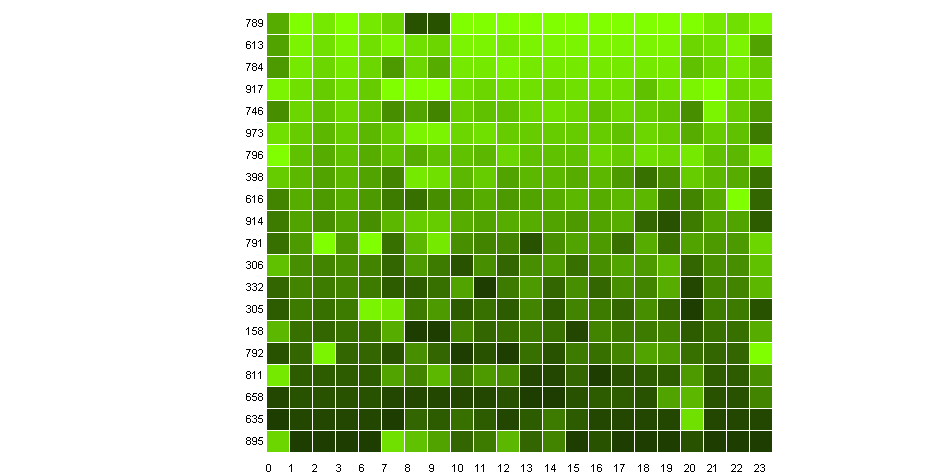
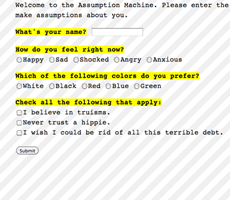
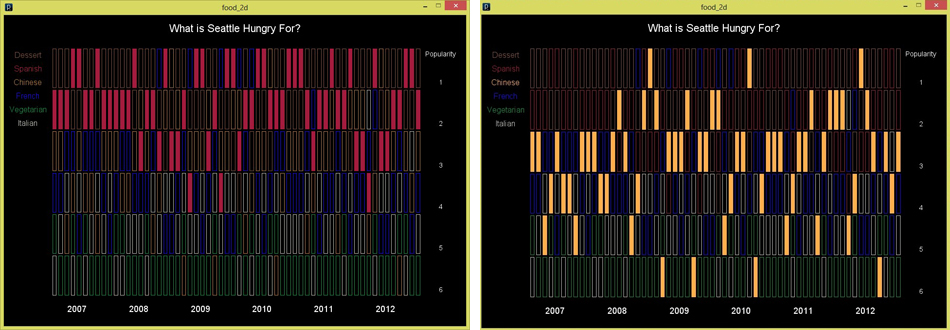
Class example 2. (easy version) This sketch is much simpler version of class example 1. For those of who have no background in programming, this sketch is much intuitive and direct in terms of implementation. This was for the beginner students, and example 1 was for the advanced level of students.


Please visit class website to see more details and more students' works.

UCSB MAT 259
Algorithmic Visualization (Processing)
UCLA Summer Institute
Web Design (HTML, CSS)
UCLA DMA 161A
Creative Internet (HTML, CSS)
UCLA DMA 161B
Dynamic Internet (HTML, CSS, PHP)
UCLA DMA 24
Motion (After effect)